
Login
Sign Up
Hello!
Welcome to hexsellation! Let me introduce myself. I am a machine learning engineer, born and raised in New York City. Most of my career I built models from public data—satellite imagery, USDA agricultural statistics, NOAA weather, FRED economic series, and many other open sources—so working with messy real-world datasets has always been part of how I think about problems.
When I was searching for an apartment, I wondered whether NYC had comparable open data that could help someone decide where to live. It turned out there is a lot of valuable information published by the city and related agencies—but it is fragmented, hard to discover, and not very approachable for most people. I built Hexsellation to pull that work together in one place and make it easier to use.
You might ask where the name comes from. Much of this information arrives as raw latitude and longitude points—crime, rodent complaints, shootings, and more—so it needs to be summarized across geography to be useful. I aggregate those events into hexagonal cells and layer on city-wide percentiles so you can see how a place compares to the rest of NYC, not just raw counts. Hexagons tile cleanly on a map in a way circles do not. The name blends hexagon and tessellation into Hexsellation. (Yes, “honeycomb” was on the table—it just felt a bit too familiar.)
Sourcing, cleaning, and turning these feeds into the layers you see here took months of work. I hope the result is useful even when you are not apartment hunting—for example, parking signs are easy to misread and forget; having them on the map can save a trip back to the curb.
Below is a reference table for each layer: where the data comes from, the coverage window, and the latest period or release we had available when we built the dataset. I hope Hexsellation feels like more than a listing search tool—something you can return to whenever you want a clearer picture of the city. Thanks for stopping by.
Sincerely,
Machine learning engineer · New York native
Layers use flat-top hexagonal cells. These diagrams show approximate distances within each size—the solid line is from the center to the middle of a side; the dotted line runs corner to corner through the center.
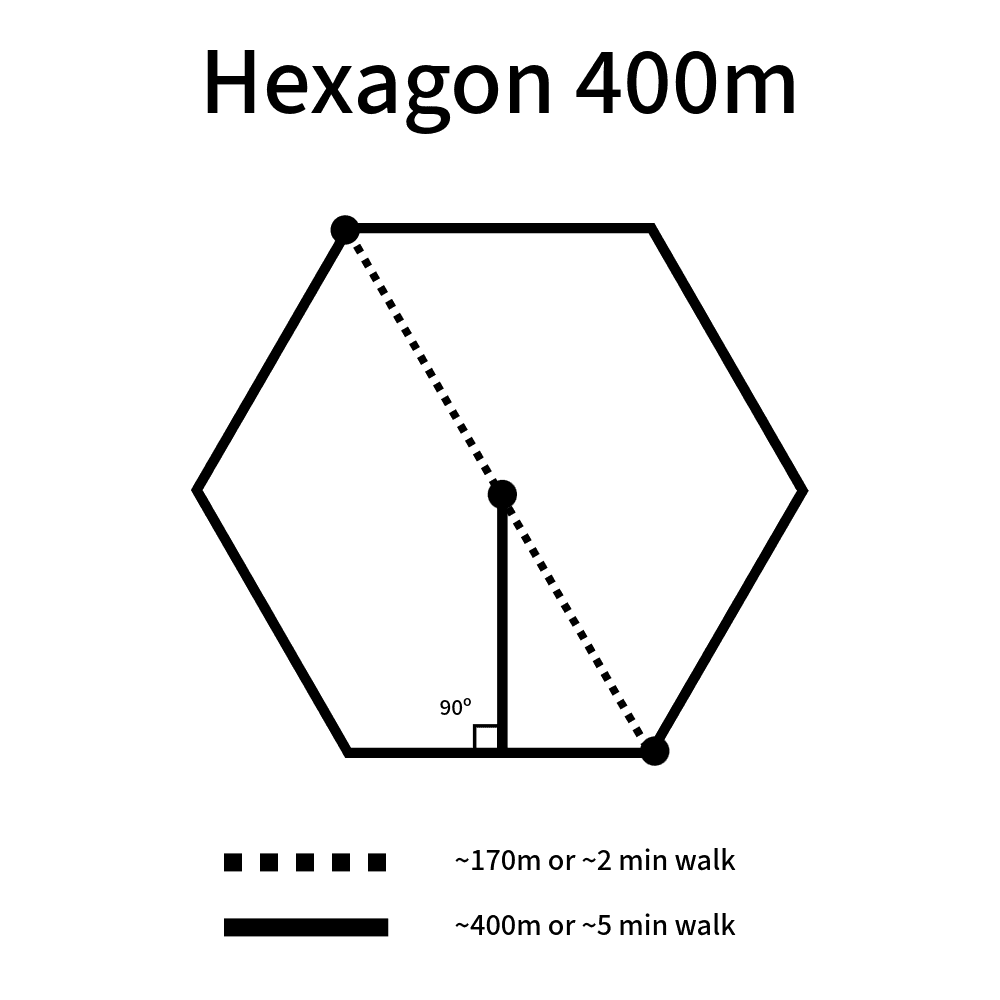

The table below has a Hexagon Type column that tells you how that layer is shown when it uses hexagonal cells. Layers marked Hexagon 400m or Hexagon 700m match the two sizes illustrated above: we typically bucket point or event locations into those hexes and sum or count inside each cell, then color by percentile (or another scale noted in the description). A larger hex covers more ground, so counts tend to be higher per cell and the map reads at a slightly coarser neighborhood scale. A “—” means that row is not displayed as a hexagon layer—for example official boundaries, zones, routes, neighborhood polygons (such as UHF 42), or discrete points—so there is no hex grid to list.
| Name | Description | Hexagon Type | Start Date | End Date | Latest Availability* |
|---|---|---|---|---|---|
| Crime | This data comes from publicly available nyc arrest data, NYPD Arrests Data (Historic). This data is then cleaned up and aggregated by hexagon by summing the total arrests that occured within that hexagon. Each hexagon corner to opposite corner (major diagonal) is roughly ~350m (~0.22miles), or roughly a 5 minute walk. The arrest data consists of many types of arrest, but for crime we narrowed it down to felonies and misdemeanors. We color by the percentile. | Hexagon 400m | 04-01-2016 | 04-01-2026 | — |
| Assault | Similar to the crime data, this data comes from publicly available nyc arrest data, NYPD Arrests Data (Historic). The arrest data consists of many types of arrest, but for crime we narrowed it down to those registered as assaults. We color by the percentile. | Hexagon 400m | 04-01-2016 | 04-01-2026 | — |
| Shootings | This data comes from a shootings incidences dataset, specific to shootings throughout nyc. Locations where the shootings occured were aggregated by sum per hexagon. We color by percentile. | Hexagon 400m | 01-01-2022 | 02-26-2026 | — |
| Rodents | This data comes from 311 Service Requests. Here we filter by complaints related to rodent sightings. Here we aggregate the raw count of complaints per hexagon. We color by the percentile. | Hexagon 700m | 2020-01-01 | 04-01-2026 | — |
| Noise | This data comes from 311 Service Requests. Here we filter by complaints related to noise. Here we aggregate the raw count of complaints per hexagon. Some descriptions of the noise were, but not limited to Loud Music/Party, Construction Noise after/before hours, Alarms, Loud Vehicles, etc. We color by the percentile. | Hexagon 700m | 2020-01-01 | 04-01-2026 | — |
| Neighborhoods & Boroughs | This data comes from Department of City Planning (DCP). | - | — | — | 03-09-2026 |
| Elementary, Middle, High Schools, Charter Schools, & Day Cares | This data comes from the Department of Education (DOE). | - | — | — | — |
| NYC Transit — MTA Bus Routes, LIRR Routes, Metro North Routes, Subway Stations, & MTA Subway Routes | This data comes primarily from MTA being publicly available. | - | — | — | — |
| Elementary, Middle, & High School Zones | This data comes from the Department of Education (DOE). | - | — | — | 11-26-2024 |
| Restaurants | This data comes from private google maps data that was aggregated by hexagons, and the total number of restaurants were counted and colored by percentile relative to the rest of the city. | Hexagon 700m | — | — | 03-01-2026 |
| Bike Routes | This data comes from the Department of Transportation (DOT). | - | — | — | 08-18-2025 |
| Dog Runs | This data comes from the Department of Parks and Recreation (DPR). Dog runs are large, fenced-in areas for dogs to exercise unleashed during park hours. | - | — | — | 03-19-2026 |
| Trees & Cherry Blossoms | This data comes from the Department of Parks and Recreation, which manage tree points. Cherry blossoms were filtered for genus species, but not limited to, Prunus - Cherry, Prunus serrulata, etc. We aggregate the raw count of trees in a given hexagon, and color by percentile. Here, parks are excluded because trees in parks are treated differently. | Hexagon 400m | — | — | 04-03-2026 |
| Lead Blood Levels | This data is from the Department of Health and Mental Hygiene. All NYC children are required to be tested for lead poisoning at around age 1 and age 2, and to be screened for risk of lead poisoning, and tested if at risk, up until age 6. This data is measured by neighborhoods as defined by the UHF 42. In 2012, CDC established that a blood lead level of 5 mcg/dL is the reference level for exposure to lead in children. We specifically chose the studies available for Children under 6 years with elevated blood lead levels (BLL) Rate BLL>=10 µg/dL per 1,000 tested. The UHF 42 neighborhoods are colored by percentile. | - | — | — | 02-07-2020 |
| After School Programs | This data comes from the Department of City Planning (DCP). | — | — | — | 10-14-2025 |
| Hospitals & Clinics | This data comes from the Department of City Planning (DCP). | — | — | — | 10-14-2025 |
| Mental Health Services | This data comes from the Department of City Planning (DCP). | — | — | — | 10-14-2025 |
| Museums | This data comes from the Department of City Planning (DCP). | — | — | — | 10-14-2025 |
| Public Services | This data comes from the Department of City Planning (DCP). | — | — | — | 10-14-2025 |
| Parks | This data comes from Department of Parks and Recreation (DPR). | — | — | — | 03-19-2026 |
| Parking | This data comes from Department of Transportation (DOT). | — | — | — | 04-01-2026 |
* Latest availability is the most recent period or release stamp in the data we collected from the source, and may not match the newest figures the agency has since published. It is not always the date we last ran our pipeline—for example, a run on 04-01-2026 can still show a 2025 date when that is the latest period available in the source.